From Questions to Answers
DataReporter is your personal guide into the world of data exploration and visualization. Imagine having the power to drag and drop your way through complex data, revealing stories, patterns, and insights—all with just a few clicks.
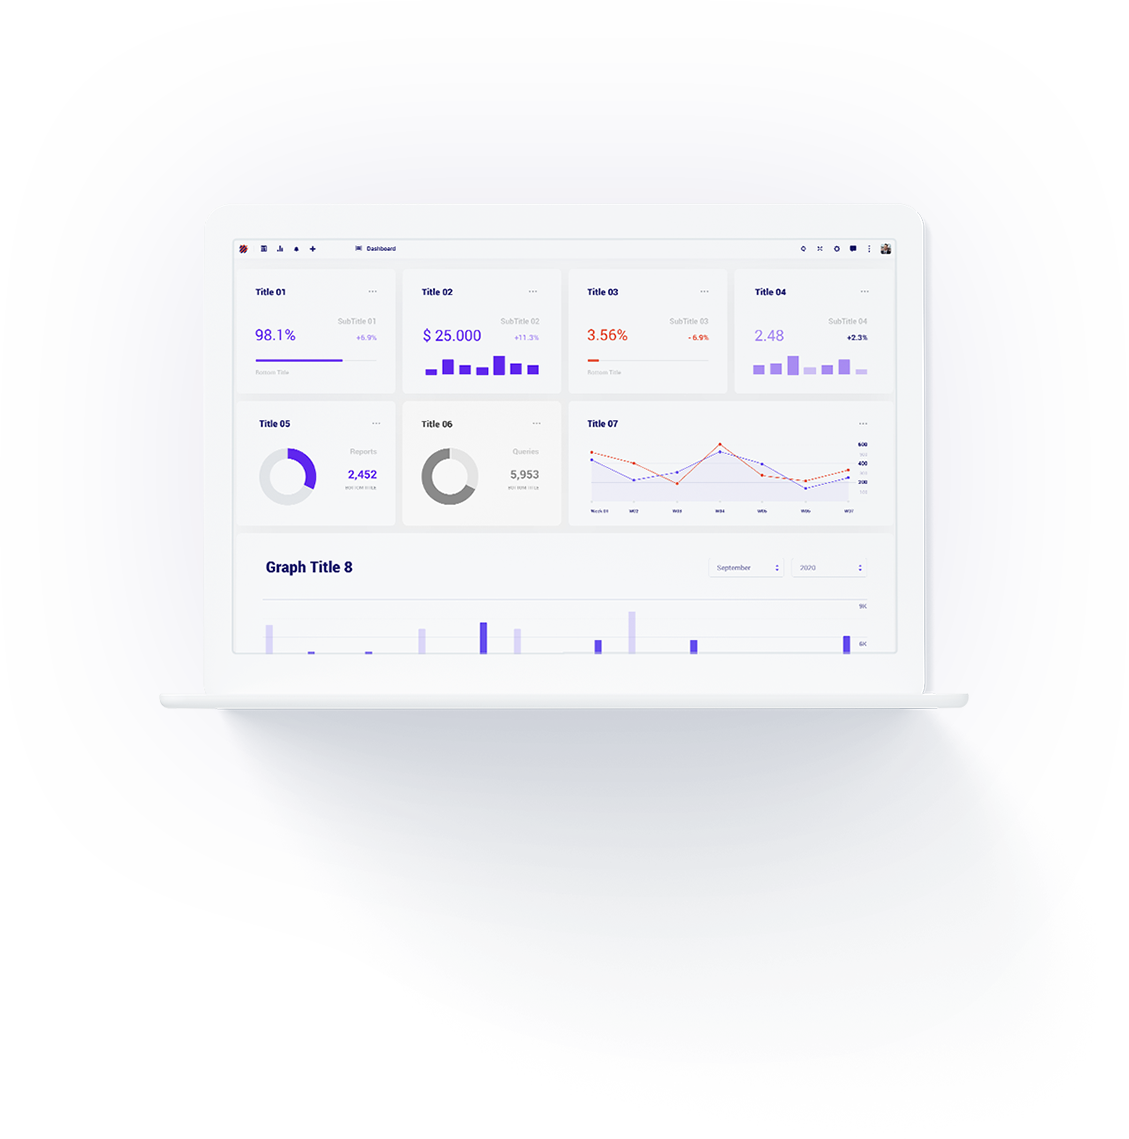
Explore and Discover Your Data
Here's the deal: DataReporter turns your raw numbers into powerful stories. With it, anyone—yes, even the non-technical folks—can create stunning reports and dashboards. The key? Interactivity. You're not just looking at static charts; you're diving in, making your data speak louder.

Technology That Works for You
It's all about control. You decide where your data lives. Whether it's on Google CloudRun — a serverless, cost-efficient Google cloud option — or within your very own Kubernetes cluster. DataReporter fits right into your existing tech ecosystem. Infrastructure Freedom: Pay only for what you use. Your data, your control.Prefer open-source? Download DataReporter and host it yourself.
Solutions
Develop curiosity about your data. DataReporter focuses on interactive data exploration allowing users to create powerful reports and dashboards with a drag and drop. Uncover patterns in your data without a need for a deep technical knowledge.DataReporter serves both the highly non-technical as well as technical users. Design Data Cubes as a code. All reports can be accessed via API.* You control the infrastructure and data in your Google Cloud.